Ridings overlay using PostGIS, Mapnik, and Mapstraction
2010-07-04
Last month I finally got around to adding a ridings overlay to the "Find your MP" tool for How'd They Vote. Here is an overview and source code for the tiles generated.
Taking the existing PostGIS ridings polygons in my database (in EPSG:4326 aka lat-long), I chose to use Mapnik to generate a set of tiles to present on top of a Google Maps base layer (conveniently presented through Mapstraction). For a primer on tile addressing and the relevant projections, see Coordinates, Tile Bounds, and Projection. Please note that the ridings polygons are based on the GeoGratis Federal Electoral Districts of Canada Shapefile.
After some experimentation, I decided on the following map definition: (ridings-simple.xml)
<?xml version="1.0" encoding="utf-8"?>
<!DOCTYPE Map>
<Map bgcolor="transparent" srs="+proj=merc +a=6378137 +b=6378137
  +lat_ts=0.0 +lon_0=0.0 +x_0=0.0 +y_0=0 +k=1.0 +units=m
  +nadgrids=@null +no_defs +over">

  <Style name="ridings">
    <Rule>
      <LineSymbolizer>
        <CssParameter name="stroke">#692032</CssParameter>
        <CssParameter name="stroke-width">2</CssParameter>
      </LineSymbolizer>
    </Rule>
  </Style>

  <Layer name="fed" srs="+init=epsg:4326">
    <StyleName>ridings</StyleName>
    <Datasource>
      <Parameter name="type">postgis</Parameter>
      <Parameter name="host">localhost</Parameter>
      <Parameter name="dbname">db</Parameter>
      <Parameter name="user">user</Parameter>
      <Parameter name="password">pw</Parameter>
      <Parameter name="table">fed</Parameter>
      <Parameter name="estimate_extent">true</Parameter>
    </Datasource>
  </Layer>
</Map>
My initial attempt included styling the whole riding polygon with the colour of the winning party, but it looked silly as one zoomed well into the riding itself (why does the whole map have a red tinge?). Wanting to keep it simple, I opted for rendering just the riding boundaries in "Elections Canada Maroon", #692032.
A code snippet from Open Street Map came in handy for generating the tiles in parallel, and for already doing all the math regarding tile bounds and naming. To suit my needs, the following modifications were made to generate_tiles.py:
112c112
<             if bytes == 103:
---
>             if bytes == 116:
113a114
>                 os.remove(tile_uri)
119a121,129
> def has_parent(tile_dir, z, x, y):
>     pz = z-1
>     px = x/2
>     py = y/2
>     pz_str = "%s" % pz
>     px_str = "%s" % px
>     py_str = "%s" % py
>     parent_uri = tile_dir + pz_str + '/' + px_str + '/' + py_str + '.png'
>     return os.path.isfile(parent_uri)
167c177,182
<                 queue.put(t)
---
>                 if (minZoom == maxZoom and z > 3 and not has_parent(tile_dir, z, x, y)):
>                     printLock.acquire()
>                     print "  skipping", zoom, str_x, str_y
>                     printLock.release()
>                 else:
>                     queue.put(t)
- 103 was changed to 116 because of bgcolor="transparent"
- empty tiles are deleted immediately after creation
- has_parent function was added to determine if a tile exists one zoom level higher (and skip generating it if not)
My version of generate_tiles.py, with the above modifications is available here.
Once I started generating the tiles, I quickly gained an appreciation for the sheer number of tiles. Disk space was quickly consumed, and I was on a trajectory to consume a few terabytes by the time I hit zoom level 18 (although I ultimately only went to level 16, and for Canada only). With each tile being 256 by 256 pixels, the tile count (entire globe) climbs as follows:
| Zoom | X by Y | Tiles |
|---|---|---|
| 0 | 1 by 1 | 1 |
| 1 | 2 by 2 | 4 |
| 2 | 4 by 4 | 16 |
| 3 | 8 by 8 | 64 |
| 4 | 16 by 16 | 256 |
| 5 | 32 by 32 | 1,024 |
| 6 | 64 by 64 | 4,096 |
| 7 | 128 by 128 | 16,384 |
| 8 | 256 by 256 | 65,536 |
| 9 | 512 by 512 | 262,144 |
| 10 | 1,024 by 1,024 | 1,048,576 |
| 11 | 2,048 by 2,048 | 4,194,304 |
| 12 | 4,096 by 4,096 | 16,777,216 |
| 13 | 8,192 by 8,192 | 67,108,864 |
| 14 | 16,384 by 16,384 | 268,435,456 |
| 15 | 32,768 by 32,768 | 1,073,741,824 |
| 16 | 65,536 by 65,536 | 4,294,967,296 |
| 17 | 131,072 by 131,072 | 17,179,869,184 |
| 18 | 262,144 by 262,144 | 68,719,476,736 |
The final python script I used to generate the complete tileset was:
import generate_tiles
map_file = "/path/to/ridings-simple.xml"
tile_dir = "/path/to/tileset/"
bbox = (-142.0, 40.0, -47.0, 90.0)
generate_tiles.render_tiles(bbox, map_file, tile_dir, 0, 8, "Ridings")
generate_tiles.render_tiles(bbox, map_file, tile_dir, 9, 9, "Ridings")
generate_tiles.render_tiles(bbox, map_file, tile_dir, 10, 10, "Ridings")
generate_tiles.render_tiles(bbox, map_file, tile_dir, 11, 11, "Ridings")
generate_tiles.render_tiles(bbox, map_file, tile_dir, 12, 12, "Ridings")
generate_tiles.render_tiles(bbox, map_file, tile_dir, 13, 13, "Ridings")
generate_tiles.render_tiles(bbox, map_file, tile_dir, 14, 14, "Ridings")
generate_tiles.render_tiles(bbox, map_file, tile_dir, 15, 15, "Ridings")
generate_tiles.render_tiles(bbox, map_file, tile_dir, 16, 16, "Ridings")
This narrowed the bounding box to Canada, generated all tiles for zoom levels 0 through 8, and then generated tiles having a parent tile in the tile pyramid (one zoom level at a time).
Finally, via Mapstraction v1, the following was added to enable the tile overlay:
mapstraction.addTileLayer('http://howdtheyvote.ca/tileset/{Z}/{X}/{Y}.png', 0.5, 'Elections Canada', 0, 16);
(This will be a bit more verbose when done directly with the Google Maps API, but is left as an exercise for the reader)
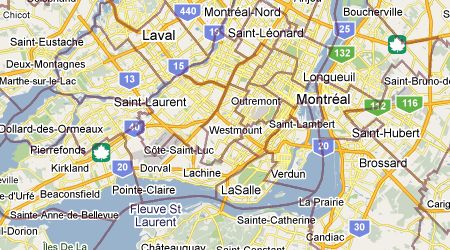
The Result
2.1G of PNG tiles generated over roughly 3 days (for zoom levels 0 through 16). When compressed, the tiles are a mere 113M.Areas for improvement
- optimize PNG files (when only one colour is used, images should be smaller)
- speed up processing time by splitting up the work (onto multiple EC2 instances?)
- prevent 404 errors using redirects to a default transparent PNG (or generate zero byte files)
- consider more attractive styles, adding labels, and possibly replacing the base layer